Conversational AI
The platform allows users to create Conversational AI agents for SMS and CALL by defining their role, voice, and knowledge base.The product includes tools to manage contacts (add, view, or delete lists for SMS and CALL separately) and to set up outreach programs that can reach over 1,000 people simultaneously, with support for multiple programs. Users can also access detailed records for both calls and SMS, including transcripts, recordings, and client responses such as missed calls or replies.
Custom AI Builder
The Custom AI Builder enables users to create a personalized, RAG-powered (Retrieval-Augmented Generation) AI assistant by uploading and managing multiple documents. It supports file formats such as Excel (.xlsx, .xls), PDF (.pdf), and JSON (.json), with a size limit of 10MB per file. Once uploaded, the system automatically processes documents, generates embeddings, and prepares them for intelligent querying.

Select and upload any Excel, PDF or JSON files from your system and you can ask questions about the uploaded documents to the AI Assistant.
Dashboard

Purpose:
The Analytics Overview page gives users a comprehensive snapshot of all department performance metrics. It allows managers and teams to quickly understand which departments are on track and which need improvement, with future options for customization..
Department-wise:
- Sales → View overall performance % and KPI breakdown (On Track vs Needs Improvement).
- Marketing → Displays percentage performance and KPI status.
- Customer Service → Highlights performance % and service-related KPIs.
- Finance → Shows percentage progress toward financial goals and KPI split.
- Human Resources → Presents overall HR performance and improvement areas.
- Legal → Tracks legal KPIs and overall score.
- IT/Tech Support → Displays IT performance and operational KPIs.
Department Comparison

- The dashboard allows for quick cross-department comparisons.
- Users can identify strong-performing areas vs those requiring extra focus.
- Helps prioritize actions and resource allocation.
Customization (Upcoming Feature)
- Users will soon be able to customize the dashboard (e.g., select KPIs, reorder cards, adjust thresholds)..
- > This feature is under development and is not yet available.
Due Diligence
The Due Diligence Management Dashboard is a comprehensive tool designed to simplify and streamline the process of managing due diligence projects. It provides a centralized interface where users can organize project data, track progress, and monitor document reviews efficiently.
Dashboard
You can create a new project using “New project” and also delete a project with the “delete” button.

Key Elements of the Dashboard
1. Project Information
- Project Name & Status: Displays the active project (e.g., project 1) and its status (Active, Inactive, etc.).
- Created Date: Shows when the project was created.
- Completion Percentage: Indicates overall progress in terms of reviewed documents.
2. Statistics Cards
- Total Folders: The total number of folders created for organizing project data.
- Total Documents: The number of documents uploaded in the project..
- Reviewed: Count of documents that have been fully reviewed and approved.
- Pending Review: Number of documents awaiting review.
3. Document Status Breakdown
Provides a color-coded summary of the document lifecycle:
- Green (Reviewed) – Documents that have been successfully reviewed.
- Yellow (Pending) – Documents uploaded but not yet reviewed.
- Red (Flagged) – Documents marked for issues or requiring further attention.
4. Quick Actions
- Manage Folders: Allows users to create, edit, or organize the folder structure of the project.
- Upload Documents: Add new files to the project for review.
- Manage Permissions: Control who has access to project data and define their roles.
- View Reports: Generate detailed analytics and progress reports.
Folder Structure:
- You can create folders or use existing folders to keep your documents with granular permissions.

- The owner can create multiple number of projects but the member can only create up to 3.
- > You can create a sub folder with the ‘+’ option, upload a file under the folders with the upload file option and delete the folders with the delete option.

Documents:
In the Documents section, you can upload, organize, and manage project-related documents. You can view the status, category, uploaded date and modified date of the documents and, view or download the documents. > You can also filter the documents by categories and share documents with other customers as well.

The owner will have complete access to all the documents but the member can only access the documents that the owner gave permission too.
AI Assissant:
In the AI Assistant section, you can ask any questions about the uploaded documents through chat. You can also view the Key Metrics, Risk Factors and Document Insights.

Audit Trail:
You can verify the complete log of all activities and changes in the due diligence process. In the recent activities, you can view the Timestamp, User, Action (like downloaded, uploaded), Target (the document), Type, Severity, IP address of the user, Details (the change made by that user) and you can also export logs.

Reports
You can see the comprehensive analysis and the overall progress of the Due Diligence. You can view the total documents, Reviewed, Pending, Completion Rate, Risk level, the Risk assessment Summary and Document Review Progress.You can also export the data to excel or generate reports.

Finance
The Finance Overview Dashboard provides a consolidated view of the organization’s financial performance in relation to established targets. This enables finance teams and decision-makers to monitor profitability, cash flow, and overall financial health in real time.

Key components of the dashboard include:
- Overall Performance – Displays the average percentage achievement across all financial metrics compared to defined targets.
- Gross Profit Margin – Measures profitability after deducting direct costs of goods sold.
- Operating Profit Margin – Indicates operational efficiency by calculating profit after operating expenses.
- Net Profit Margin – Reflects overall profitability after all expenses, taxes, and deductions.
- Cash Flow – Tracks liquidity by measuring the net amount of cash moving in and out of the business.

Finance Chat enables users to ask finance-related questions and automatically retrieves accurate responses by connecting with their QuickBooks account. It also provides intelligent query suggestions to help users access relevant financial insights more efficiently.
For example, users can:
- Upload invoices to generate and review Profit and Loss (P&L) reports from a specific CSV file.
- Track expenses and income across defined categories.
- Monitor cash flow and financial trends in real time.
This feature simplifies financial analysis by reducing manual effort and ensuring quick, data-driven decision-making.
Human Resources
The Human Resources (HR) Overview Dashboard provides a consolidated view of key HR performance indicators (KPIs) to help track workforce efficiency, employee satisfaction, and talent management effectiveness. This dashboard allows HR teams and management to monitor progress against defined targets, identify gaps, and take corrective actions in real time.

Key highlights of the dashboard include:
- Overall Performance: A percentage score showing how HR performance compares with set targets.
- Core HR Metrics: Indicators such as Employee Turnover Rate, Time to Hire, Training Completion Rate, and Employee Engagement Score, each benchmarked against target values.
- Performance vs Target Analysis: A visual comparison (bar chart) between actual results and expected goals across all key HR metrics.
- KPI Distribution: A pie chart breaking down the weightage of different HR performance metrics for better visibility.
- 12-Month Performance Trend: A line graph that highlights how HR performance has varied over time, making it easier to spot long-term patterns and areas requiring attention.

The Human Resources Chat feature allows users to ask HR-related questions and receive intelligent, context-aware responses. It seamlessly integrates with your LinkedIn account to provide relevant insights, connections, and resources.
In addition to answering queries, the chat also offers suggested questions to guide users in exploring common HR topics more effectively.
For example:
- Users can request the system to create or edit a LinkedIn post directly through the chat.
- Users can also ask for networking suggestions, talent insights, or recruitment support via LinkedIn integration.
IT Tech Support
IT/Tech Support Overview:
The IT/Tech Support Overview dashboard provides a consolidated view of technical support performance metrics, enabling teams to track efficiency, responsiveness, and service quality. It highlights critical KPIs such as open tickets, average resolution time, customer satisfaction, and system uptime.

This dashboard empowers IT and support teams to:
- Monitor ticket volume and resolution trends.
- Assess service quality against defined targets.
- Identify areas requiring improvement in response time and support processes.
- Ensure system reliability and high customer satisfaction levels.
IT/Tech Support Chat:
Ensure that your tools(Jira, Outlook, Weather, Gmail, Slack, Teams, AWS) are connected on the Integrations side.

IT/Tech Support Chat allows users to ask support-related questions and connect seamlessly with multiple platforms such as Jira, Outlook, Weather, Gmail, Slack, Teams, and AWS. By selecting an option, the system retrieves real-time information from the respective account and provides quick, actionable answers. Users can also leverage suggested queries to explore data more efficiently.
Examples of supported queries include:
- Jira – View tasks assigned to you, check recent activity, and track project updates.
- Outlook – Access contact lists, review sent emails, and manage communications.
- Lawn Service – Get revenue predictions and performance insights.
- Weather – Check today’s or yesterday’s weather conditions.
- Gmail – View emails sent over the past week and manage mailbox activity.
- Slack – List all channels you are a member of and send messages to specific channels.
- Teams – Review upcoming meetings and collaboration schedules.
- AWS – Add new items in Pipedream, view existing resources, and manage cloud operations.
Marketing
The Marketing Overview Dashboard provides a comprehensive view of marketing performance by tracking key metrics against defined targets. It enables marketing teams to monitor traffic, engagement, and campaign effectiveness in real time, supporting data-driven decision-making.

Key components of the dashboard include:
- Overall Performance – Shows the average percentage achievement across all marketing KPIs compared to targets.
- Website Traffic – Tracks the number of website visits against the monthly or campaign-specific target.
- Cost per Lead (CPL) – Measures the efficiency of marketing spend by calculating the average cost required to acquire a lead.
- Email Open Rate – Reflects the effectiveness of email campaigns by tracking the percentage of recipients who opened marketing emails.
- Social Media Engagement – Captures interactions such as likes, comments, and shares, indicating the impact of social media efforts.

Marketing Chat allows users to ask marketingrelated questions and retrieve real-time insights directly from their Mailchimp account. It also offers suggested queries to help users quickly access relevant campaign and audience data.
For example, users can:
- View audience growth statistics over a selected period.
- Access a list of all active and past campaigns within their account.
Sales
Ensure that your HubSpot account is already connected in the Tools Integration.
(Account Settings -> Integrations -> Connect Tools)

You can see the Monthly Revenue, Sales Growth Rate, Customer Lifetime Value and Lead-to-Customer Conservation Rate in the Sales Overview.

Sales Chat allows you to ask sales-related questions and automatically pulls real-time answers from your HubSpot account. It also provides smart query suggestions to help you explore data faster.
For example, you can:
- View all active deals
- Compare performance across different deal stages
- Track sales progress and pipeline insights instantly
This makes it easier for teams to get quick, actionable sales intelligence without switching tools.
Sign‑Up Page
This document explains how a new user creates an account from the Sign up page.It includes a step‑by‑step walkthrough.

Create a new LLM Software account for a user.
Step‑by‑Step: Create an Account
- Open https://llmsoftware.com/ in your browser.
- Sign-in: If you don’t have an account click Get Started or else click sign-in .
- First Name: Enter your given name.
- Last Name: Enter your family/surname.
- Email: Enter a valid email address you can access (used for verification and notifications).
- Username:
1. Defaults to your email in many environments.
2. You can change it if a unique username is required (follow your org’s naming rules if any). - Password:
1.Enter a new password.
2. Use the eye icon to show/hide if needed. - Confirm Password:Re‑enter the same password.
- Agree to Terms: Check I agree to the Terms and Conditions (review the linked terms).
- Create Account: Click Create Account.
- (If enabled) Email verification:
1. Check your inbox for a verification email.
2. Click the verification link to activate the account. - Sign in: After account creation/verification, use the Sign in link to log in with your credentials.
Security & Privacy
Read the terms and conditions page thoroughly before clicking the agree button.
Integrations
- Connect the necessary tools provided like Quickbooks, Hubspot, Slack,etc.
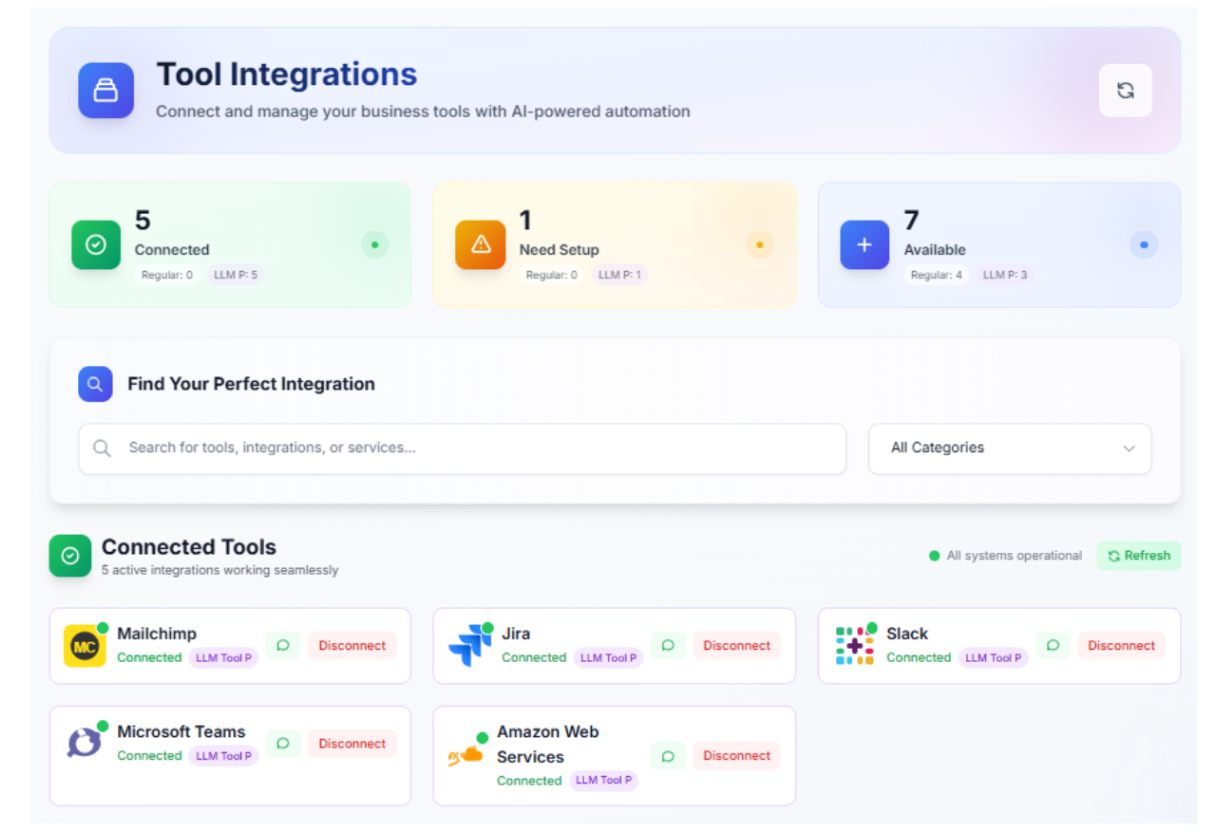
- After connecting you can see the connected tools and if you want to add more you can check with available tools.
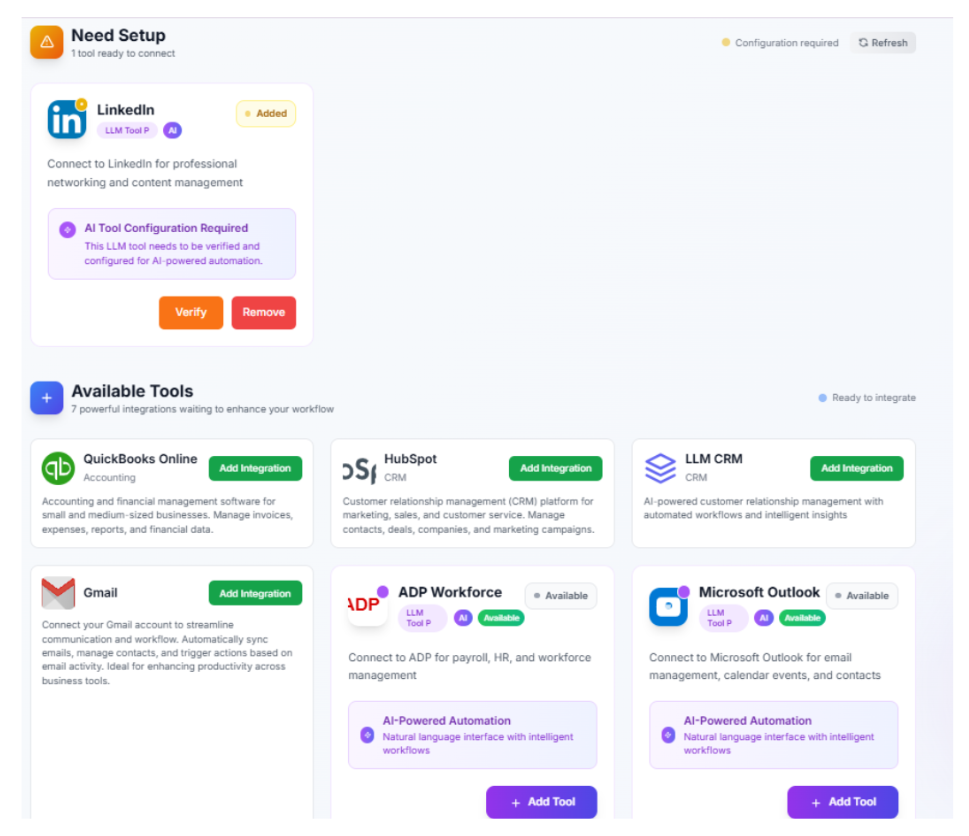
- Connect all with your respective accounts. It has to be connected by the following method..
- Quickbooks →Quickbooks requires users to log in with admin privileges.
- HubSpot →Api key of the user is needed to connect with their respective account.
- Jira →Jira requires users to log in with admin privileges.
- Slack →Slack requires users to log in with admin privileges.
- LinkedIn →LinkedIn requires users to log in with admin privileges.
- Mailchimp →Mailchimp requires users to log in with admin privileges.
- Outlook →Outlook requires users to log in with admin privileges.
- Teams →Teams require users to log in with admin privileges.
- AWS →AWS requires users to log in with admin privileges
- Gmail →Gmail requires users to log in with admin privileges.
Team
This guide explains how to manage your organization members and invitations, including adding, viewing, and removing team members. It also covers how to send and track invitations.
1. Team Members
The Team Members section shows all users currently part of your organization. It displays each member's name, email, role, join date, and provides the option to remove them.

2. Invite a New Member
To invite a new member to your organization:1. Click the 'Invite Member' button.
2. Enter the email address of the person you want to invite.
3. Optionally, add a personal message.
4. Click 'Send Invitation'.
The user will receive an email with instructions to join your organization.

3. Invitations
The Invitations section lists all invitations sent. Each entry shows the invited email, role, status (pending/accepted), and the date the invitation was sent.

4. Removing a Member
To remove a member:1. Locate the member in the Team Members list.
2. Click 'Remove' next to their name.
